

Why Location is the Key to Connecting Your Facility Systems
Most facilities teams still run on multiple legacy systems with siloed data. Location is the common thread that can bring them all together.
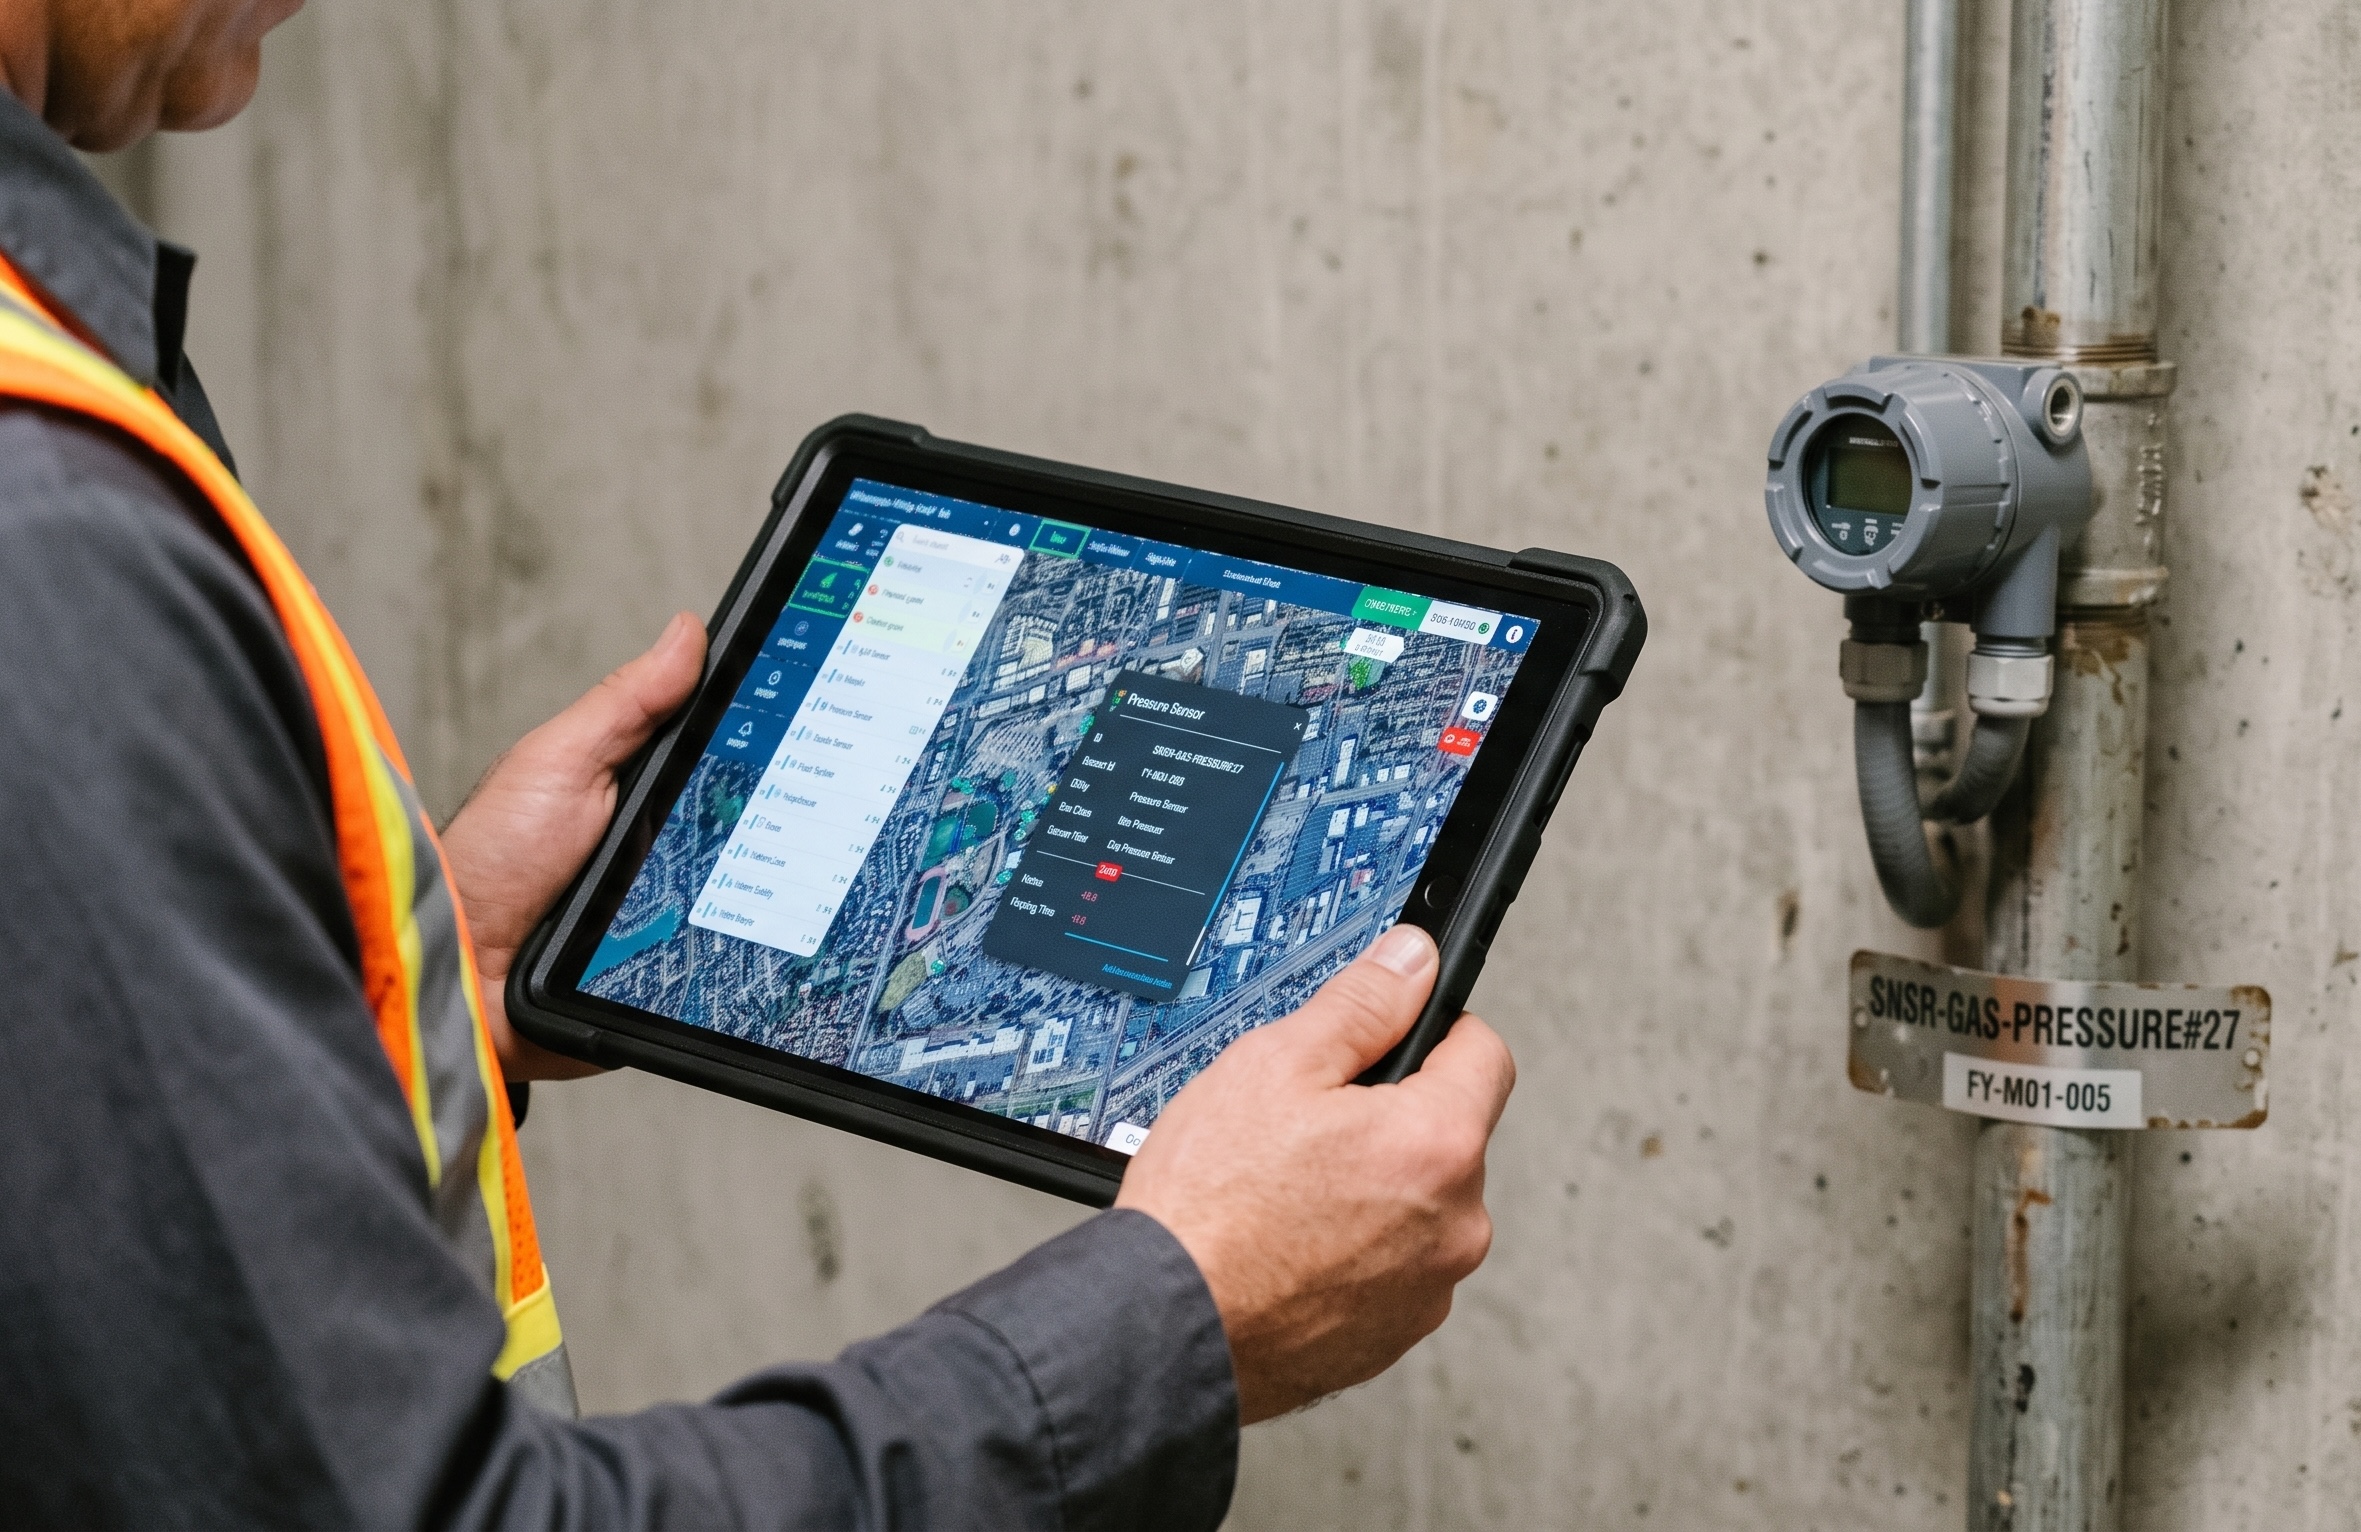
A sensor flags a pressure anomaly. The alert sits in a dashboard nobody checks regularly. The maintenance history that could explain it is in the CMMS. The relevant drawing is a PDF in someone’s inbox. Everything needed to catch a potential problem exists. It just sits in four different places.
That’s not a failure of any one system. Each one does its job. The failure is in the disconnection.
The cost of data silos
Most facilities teams run on more than one system: work order management, a CMMS, space management tools, IoT sensors, real estate platforms, and shared documents. Each was chosen for a good reason. But when those systems don’t communicate, the team pays a quiet tax every day. Information gets duplicated, context disappears, and someone ends up toggling between platforms to piece together a picture that no single system holds.
Many of these systems were also built for a single purpose, years ago, before facilities teams needed mobility, visual interfaces, and instant access to information from any device. They weren’t designed for the way teams work today.
A hub, not another silo
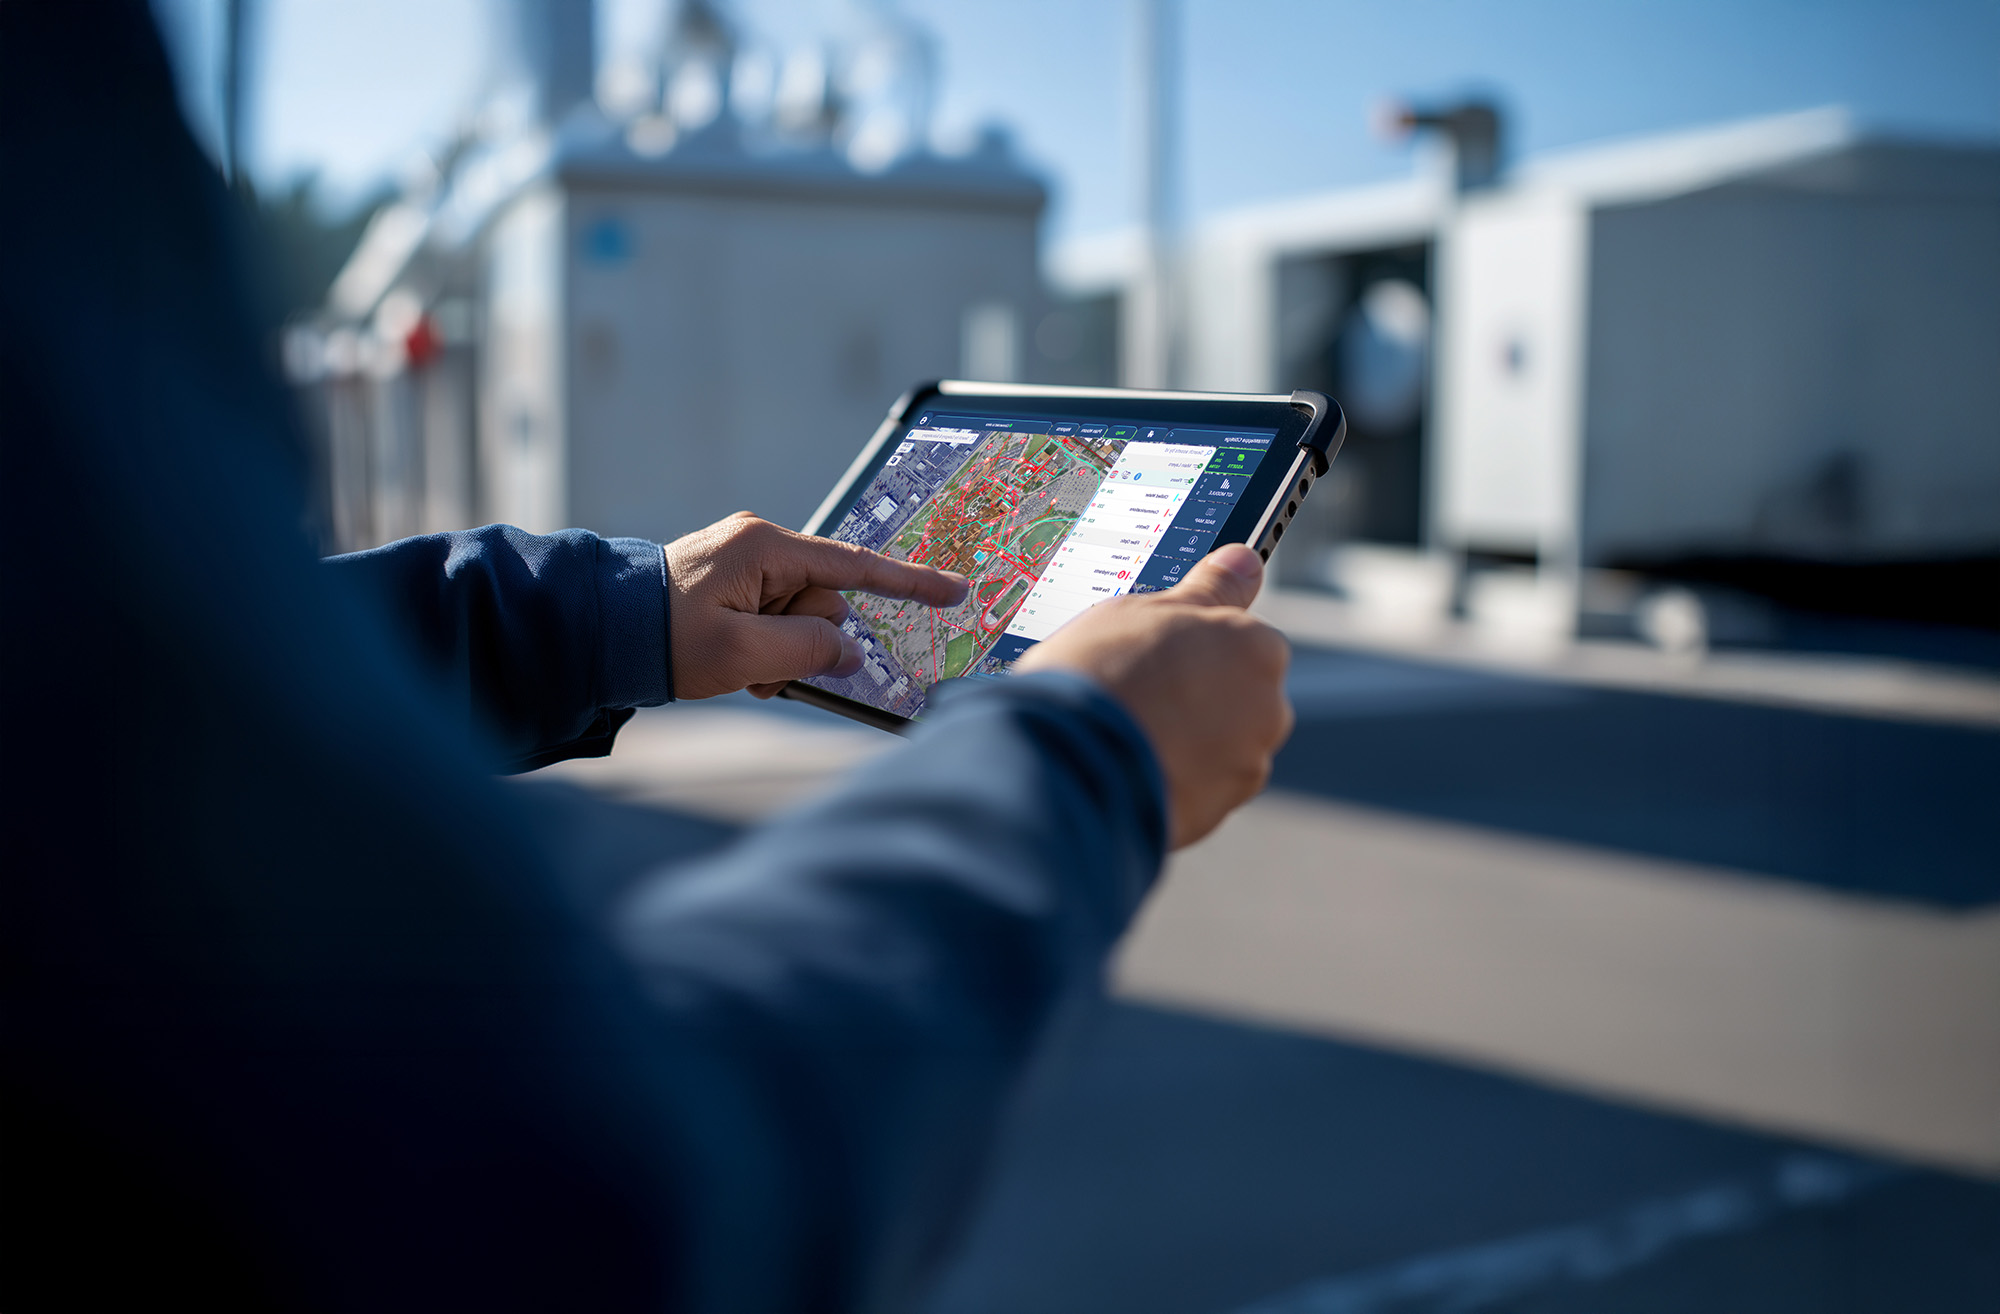
InfraMappa takes a different position in your technology stack. Rather than adding to the complexity, it acts as the connective layer that brings your existing systems together into one mapped view of your facility.
The map isn’t a cosmetic layer. Location is the shared language of facility data and the element most systems fail to show clearly. Put a work order, a sensor reading, a maintenance record, and space data on the same asset in the same place and they go from being separate records to one operational picture.
What it looks like in practice
Click a mapped asset in InfraMappa and you’ll see everything your connected systems know about that asset. The context your team needs is right there, without having to piece it together from multiple places.
For any mapped asset, that includes:
- Open work — See what’s open, who owns it, and what’s pending.
- Maintenance history — Understand what has failed, changed, or been repaired before.
- Live conditions — See what’s happening now, not what a report showed last week.
- Space context — Know where the asset is and which rooms, floors, or systems it serves.
Vital signs, continuously
The clearest example is IoT. When temperature, moisture, pressure, and energy readings are connected to the map, InfraMappa becomes a live view of your facility’s vital signs. A reading drifting out of range no longer waits inside a separate dashboard. It appears in geographic context, tied to the exact asset and location it’s coming from, while there’s still time to act.
Integration shouldn’t become another project
Integrating two or more systems typically requires deciding what data to share, how the systems should relate, and who will do the technical work of connecting them. InfraMappa handles all of that. With read-only access to your existing systems, the integration can be executed quickly and without disruption to your current workflows. Your team gets the information they need, in context, without adding complexity to their day.
Location is the one thing every piece of facility data has in common. When your systems share that common ground, the full picture finally comes into view.